Digital analytics and life sciences companies rely on vast amounts of data: from developing drugs to delivering them to customers.
Getting, the right digital analytics designed is key to your success!
We have both the Value Chain, which is a complex system producing data to multiple places and the Value Stream which takes a look at a series of steps that occur to provide the product or service that the customer is desiring and is willing to pay for. This makes it very difficult to extract and use data, especially at speed.
For this article we will focus on the design of Digital Analytics from the 60,000 foot view of the Value Chain trickling down to the granular level.
There are multiple entry and exit points within this Value Chain, and sometimes there are different systems that cannot or don’t talk with eachother, mostly because they are programmed in different formats, and may even come from different vendors.
One part of the value chain may be using an Enterprise Resource Planning software which manages the day-to-day business activities such as accounting, procurement, project management , compliance and supply chain operations, using ORACLE, and another part of the value chain may be using SAP, for example.
I’ve been engaged by very well-known Fortune 500 organizations still managing these functions using excel spreadsheets. One company cobbled ORACLE and Agile as an intermediary to Excel.
Yikes, Three systems!!!
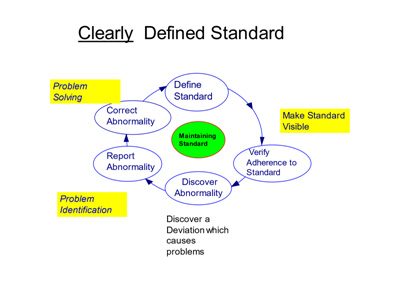
Standardization is key to eliminating variation because variation is the enemy.
If there is no clearly defined process, then it becomes more difficult to understand where there might be some data variation coming in or being collected.

Having a clearly defined standard makes data more useful for collaborative study, modeling, and large-scale analytics. Data standardization is a necessary process to increases the speed at which data analysis can work.
The need for data standardization has grown exponentially as data sources become more and more diverse, regardless of sector, industry, or business purpose. And completing the process of data standardization at scale often means the difference between success or failure for a business today.
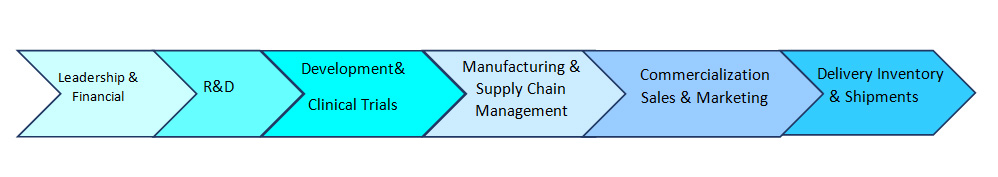
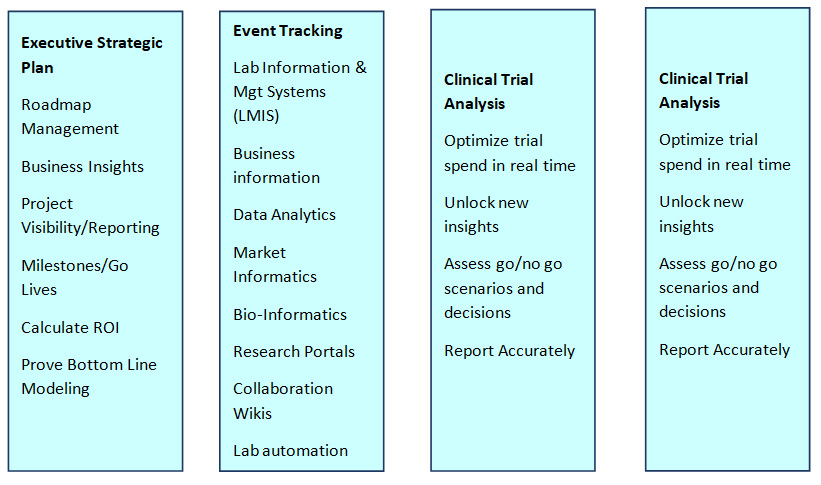
Identifying and integrating where we have connections may become difficult, so a “best practice” is to first construct a “high altitude” Level 1 flow map of what happens in each of these steps. The example below would be a good example of Level 1 flow map.
Level 1 Flow Map
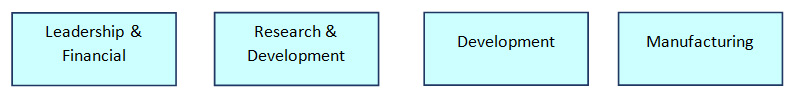
The second step is to enter the details for the extension of each of the Level 1 categories. You don’t want to get too much into the weeds yet or go down a rabbit hole.
Level 2 Flow Map
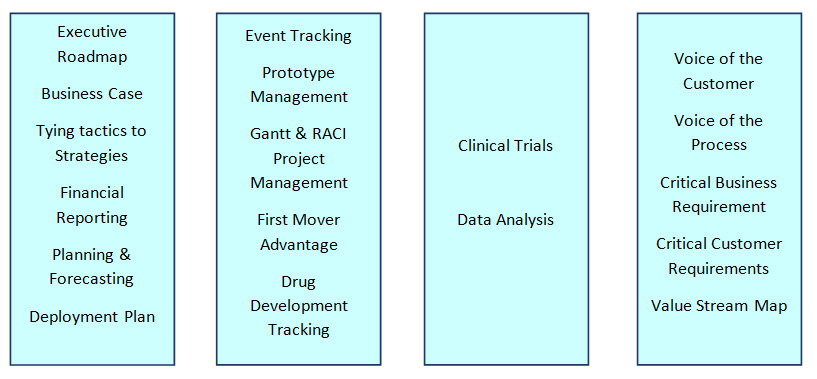
The third step would be the detailed list of each process step you want to capture, again go to where the action is, where people are coding or entering data. “Go See” first-hand each of these steps, so you can appreciate the full value. Your outcome will suffer with a room full of brilliant minds that think they “know,” but are designing a process in a vacuum. It may seem like this practice might lengthen your analysis and design process, but in the long run, you will save time, and reduce rework. Digital lean six sigma is about unlocking the data at each of these levels and connecting the hand-offs through each value stream, integrating different systems, departments, and regions.
Level 3 Flow Map
You must give the team time to reflect. It’s like trying on a pair of shoes. You want to walk around in them for a while to make sure you have a comfort fit. If you are not practicing a time-zone hand-off, then partner with a digital developer or integrator in another time zone to keep progress going 24-hours a day. By the time it comes back to your team, you’ll have made significant progress. A different set of eyes and ideas may also provide you with the diversity you need in order to generate more ideas.
INFORMATION WASTE
- Redundant input and output of data
- Incomplete information systems
- Manual checking of data that has been entered electronically
- Data dead-ends (i.e.: data that is input but never used)
- Re-entering data
- Converting formats
- Unnecessary data
- Unavailable, unknown, or missing data
- Incorrect data
- Data safety issues (lost or incorrect data)
- Unclear or incorrect data definitions
- Data discrepancies
- Non-specific data, described in general terms, rather than at granular level, Example: “other”
Look for the People waste at your company or in your immediate team.
- Unclear roles & responsibility, authority and accountability
- Lack of Training
- Work or Task Interruptions
- Multi-tasking
- Underutilization of Talent
- Recruiting Errors – Not utilizing a Talent Optimization platform, like Predictive Index
- Lack of Strategic Focus
Conclusion
Businesses today are facing new and rising expectations from customers and greater complications as new digital channels emerge. Organizations that have invested in looking and analyzing their processes from end-to-end to reduce development costs and lead times will be better prepared to shift when the next business disruption occurs. Armed with solid lean design and business operations principles will help your organization through its transformation and will help tie your business strategies to your development teams. You can generate the insights and the agility to “close the gap” so your customer experience you are delivering, (Voice of the Process-VOP) and the experience your customers expect(Voice of the Customer – VOC) can be congruent.
Look for the waste of Information in the current data connections: